What is Watson Watching in the Grains Sector this Week?

This past weekend saw consistent rains across much of the US Midwest, a situation that used to spark active selling in the pits of the Chicago Board of Trade.
Rain accumulation the past week also was widespread, as expected, likely improving production projections for both 2025 US corn and soybean crops.
Yet early Monday morning found only light selling interest overnight, keeping in mind corn contracts completed bullish technical patterns on weekly charts last Friday.
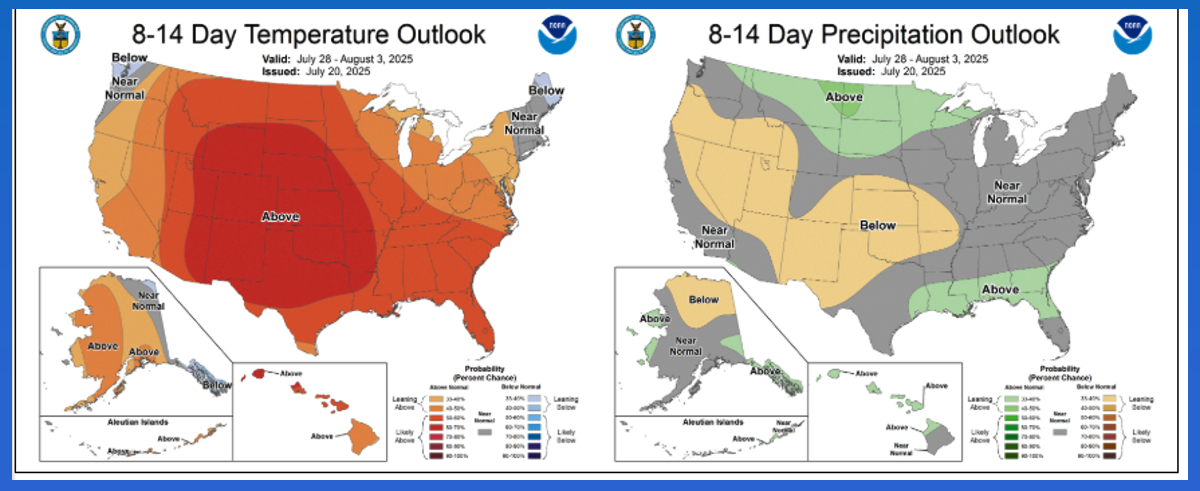
Morning Summary: As this past weekend progressed, I kept checking national radar maps and what I saw was rains over much of the US Midwest. In days gone by, weather such as this, in late July no less, would’ve dropped December corn and November soybeans futures limit down either at the open of the next session or shortly thereafter. But that was back when human beings fought in the trading pits of the Chicago Board of Trade. Watson runs things now, and while weather is still a key feature, it is part of the equation that includes a number of technical variables. Speaking of technical analysis, the question again rises as to if there is value to traditional patterns and signals if Watson doesn’t use them[i]. As last week came to a close, the Grains sector saw a number of bullish technical patterns heading into a weekend that looked bearish from a weather point of view. On the subject of weather, Monday’s forecast calls for more rain across most US growing areas. Last week saw the expected rain accumulation while the next 8-to-10-day forecast covering July 28 through August 3 shows a mix of precipitation expectations and summer heat. Let’s see how all this plays out in the Grains sector.
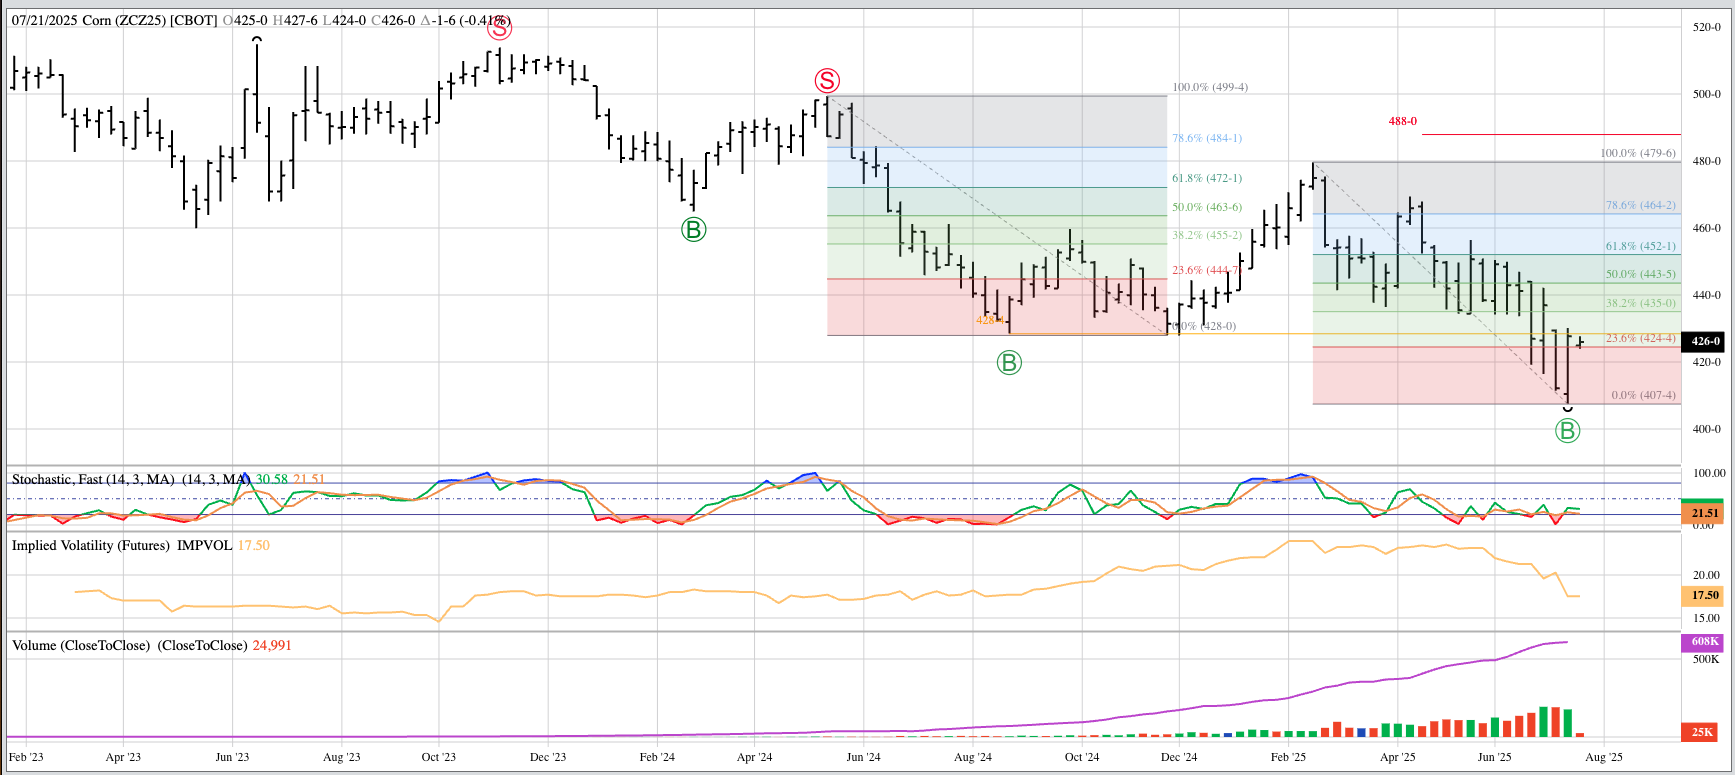
Corn: Let’s start the week as we always do, with a look at the corn market, this time coming out of a wet Midwest weekend. After drilling another hole in my head performing a home lobotomy, I’ll bring up NASS’ previous edition of completely made-up weekly crop condition numbers that put the DNAI Crop Condition Index at 196 points. Recall this was the highest Week 7 index score since 2018’s 199 points. While I know these numbers don’t matter in the real world, there are many in the industry who hold them sacred. Therefore, if we take US corn’s high imaginary score and add more rain this past week, the 2025 crop should still be in good shape, right? Okay, how about if we finally add some summer heat into the mix, something many folks across the US Midwest have told me was needed to finish this bin buster of a crop. Historically, the sum of this equation would be corn futures in the red, and not by just a little bit. A look at Monday’s early morning market and we see both September (ZCU25) and December (ZCZ25) down about 3.0 cents on light overnight trade volume of 8,000 and 21,000 contracts respectively. This after both turned technically bullish last Friday.
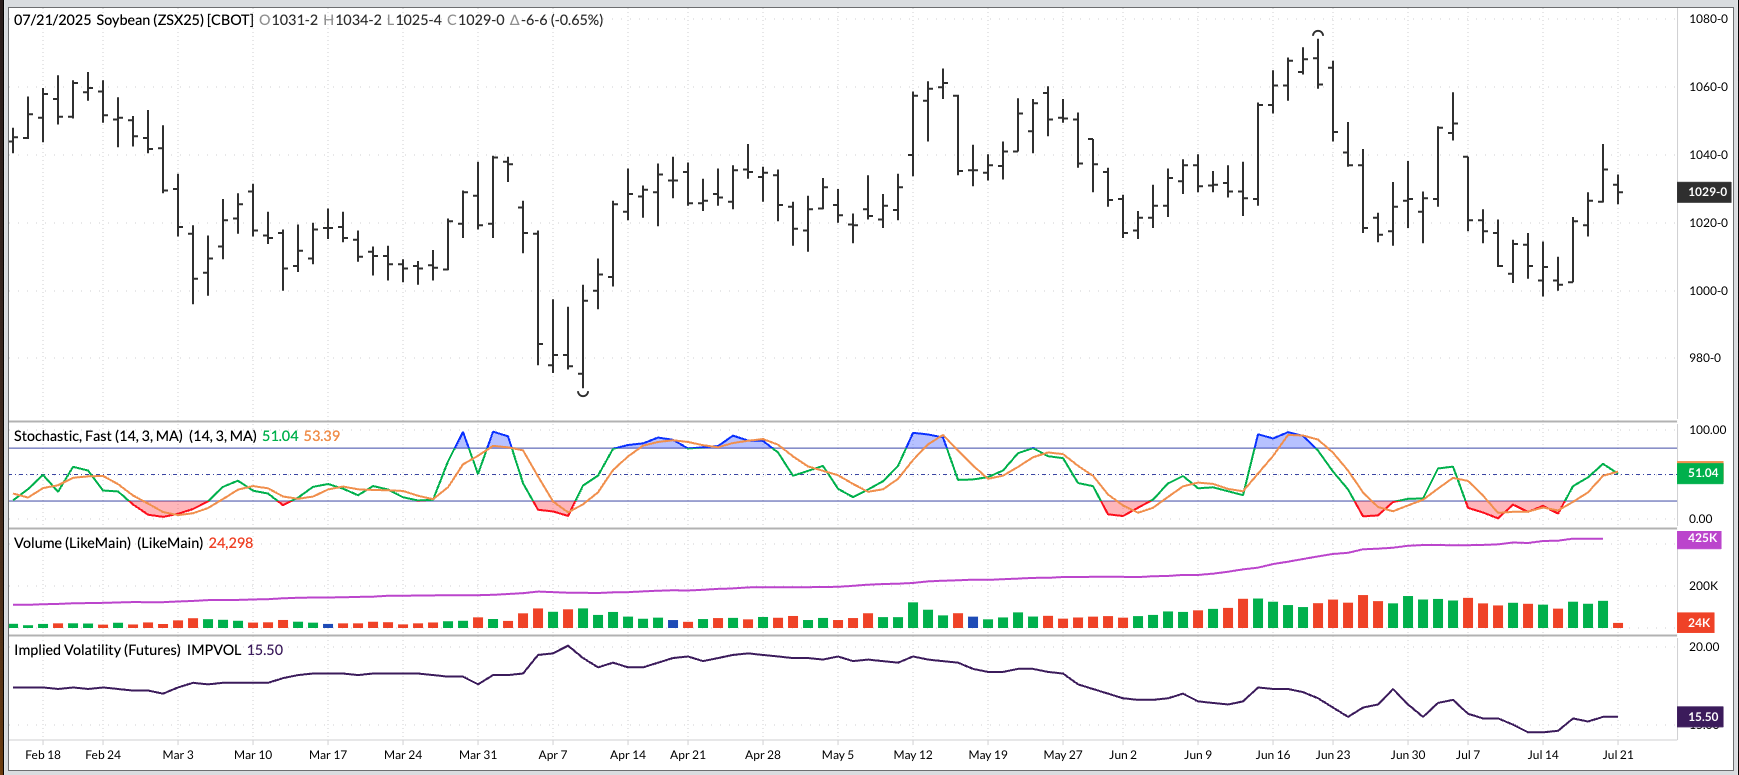
Soybeans: It was a similar story in the soybean market. If it seems I start this segment with that sentence a lot these days, you are correct. This indicates both soybeans and corn still have a component of weather derivative to them, just different than what it was in the past. Or so it seems. Also at this time of year, we only have to look at the November issue (ZSX25) overnight. Here we see nearly 22,000 contracts changed hands through early Monday morning, still not heavy trade volume, as Nov25 dropped as much as 10.25 cents and was sitting 8.0 cents lower at this writing. I could spend time talking about futures spreads, but as I said there is no point given the lack of overnight trade interest in deferred issues. Neither January nor March have yet reached 2,000 contracts traded. Fundamentally, the North American Nov-Jan futures spread covered 62% calculated full commercial carry at last Friday’s close, unchanged from last week, while the South-American dominated March-May covered 42% as compared to the previous Friday’s 45%. Again, neither is bullish. The National Soybean Index was calculated Friday evening near $9.8525 putting old-crop available stocks-to-use at 15.9% as compared to the previous 10-year end of July average of 15.6%.
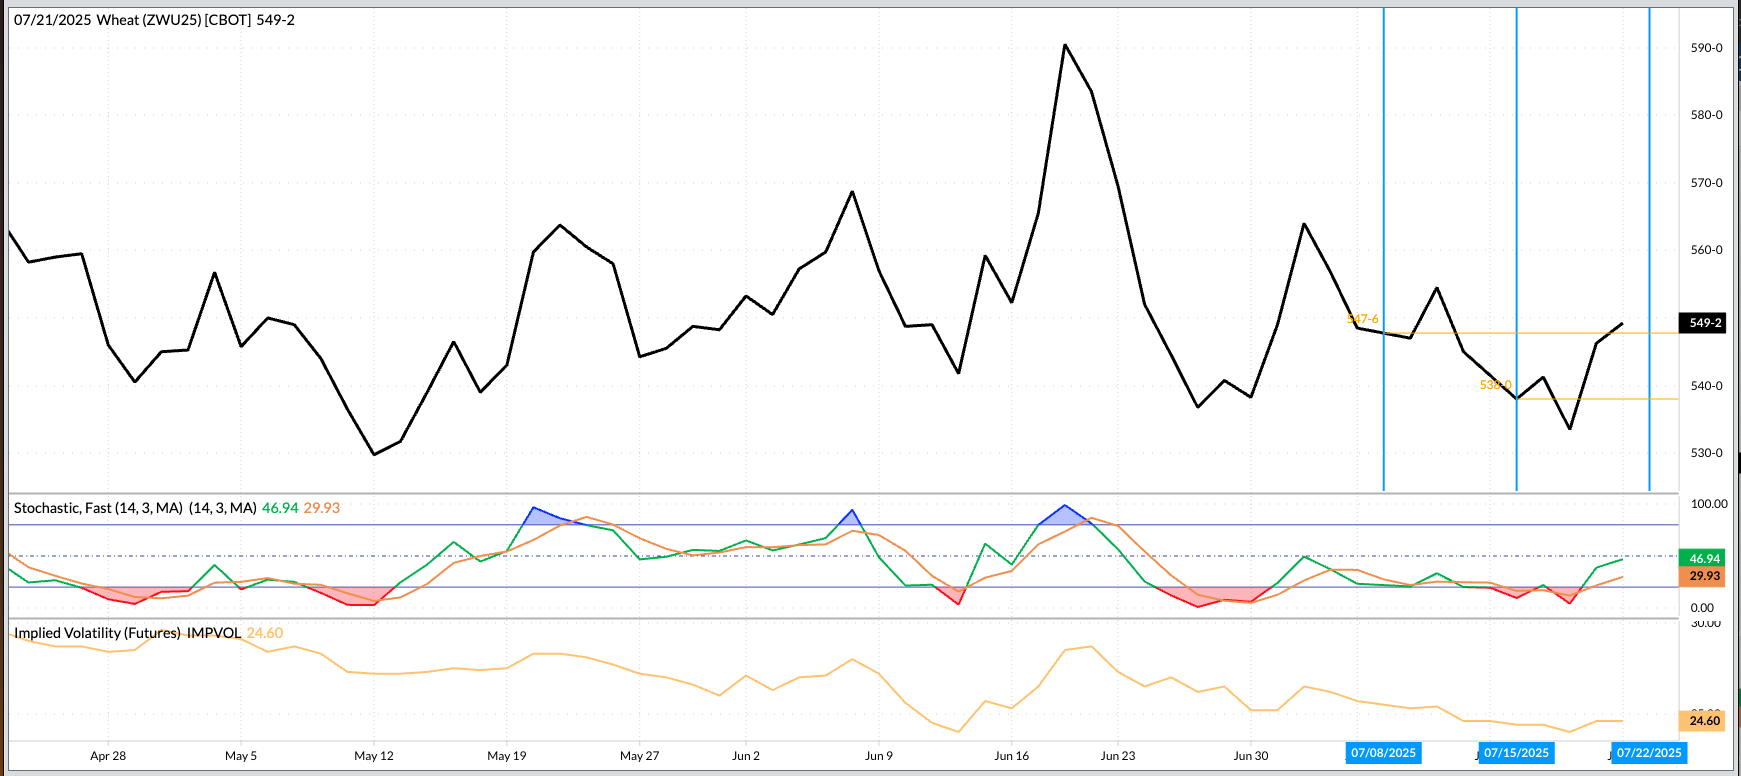
Wheat: The wheat sub-sector was mostly higher pre-dawn Monday. Why? My Blink reaction is because there were more buy orders than sell orders, but only barely. I know, that is a rather simplistic bit of analysis, but there isn’t much to build on with the three markets. September SRW (ZWU25) was sitting 1.25 cents higher on trade volume of 4,200 contracts while the nearby HRW issue (KEU25) as up 0.75 cents while registering 1,900 contracts changing hands. Theoretically, a small selling spree by Watson would be enough to take both back into the red before Monday morning’s intermission. Fundamentally, last Friday saw the National SRW Index come in near $4.9125 putting available stocks-to-use at 45%. At the same time, the National HRW Index was calculated at $4.77 putting available stocks-to-use at 45.3%. The previous 10-year average end of July figures are 43.3% and 43.2% respectively. In other words, the US is not running out of winter wheat and based on the Wheat Reality – One bushel of wheat left over is too many – and the economic Law of Supply and Demand, winter wheat fundamentals could still be viewed as bearish. September HRS (MWU25) was sitting 0.25 cent lower at this writing on trade volume of 315 contracts.
[i] I will be talking about all this an more at this week’s Barchart Grain Merchandising & Technology Road Show in both Ames, Iowa and Manhattan, Kansas.
On the date of publication, Darin Newsom did not have (either directly or indirectly) positions in any of the securities mentioned in this article. All information and data in this article is solely for informational purposes. For more information please view the Barchart Disclosure Policy here.